How to Measure Wood Dust Particle Levels in a Small Workshop: A Step-by-Step DIY Guide to Accurate Air Quality Monitoring
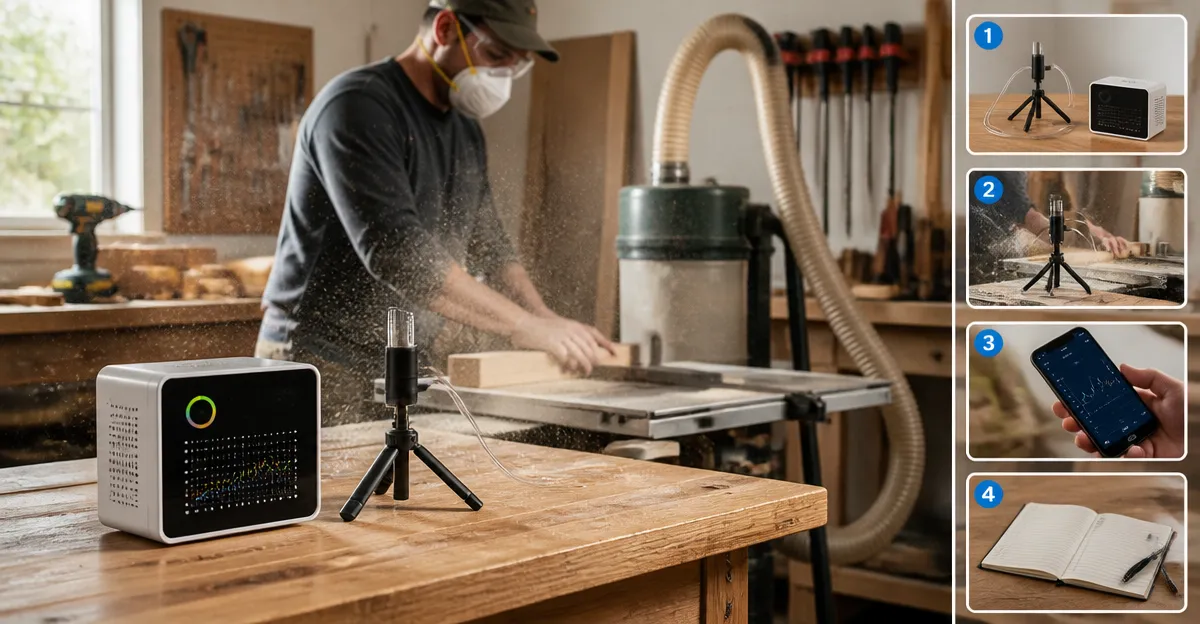
This guide teaches readers how to reliably measure wood dust particles in a compact workshop environment. Accurate monitoring protects respiratory health, ensures compliance with safety standards, and informs ventilation improvements. By following the outlined steps, one can obtain real‑time data, export historical trends, and make evidence‑based decisions without needing specialized laboratory equipment.
What You'll Need
- GoveeLife Smart Air Quality Monitor
- Temtop Air Quality Analyzer
- Temtop Air Quality Monitor
- Power outlet or USB‑C charger
- Notebook or computer for data export
- Basic hand tools (screwdriver, tape)
Step 1: Establish a Baseline with a Fixed‑Location Sensor
Begin by placing a permanent sensor at a central location in the workshop. The GoveeLife Smart Air Quality Monitor is ideal for this purpose because it provides continuous PM2.5, temperature, and humidity data while integrating with Wi‑Fi for remote access. Its high accuracy (±15 µg/m³ for PM2.5) and two‑second refresh rate ensure that even rapid dust spikes are captured.
- Price: $39.98
- Rating: 4.3/5 (1,052 reviews)
- Key features: LED display, night mode, GoveeHome automation compatibility, 13‑day online graphs, 2‑year data export.
Mount the monitor on a wall at breathing height (approximately 4‑5 ft). Connect it to a power source using the supplied Type‑C cable. Use the top button to switch to the PM2.5 display and enable night mode if the workshop operates after dark. This baseline will reveal ambient dust levels before any woodworking activity begins.
Step 2: Select a Portable Analyzer for Spot Measurements
While the fixed monitor records overall trends, a portable device captures dust concentrations at specific workstations. The Temtop Air Quality Analyzer offers 8‑in‑1 functionality, including CO₂, formaldehyde (HCHO), PM2.5, PM10, temperature, and humidity. Its rechargeable battery and backlit TFT display make it suitable for moving between sanding stations, saw benches, and finishing areas.
- Price: $167.99
- Rating: 4.3/5 (243 reviews)
- Key features: NDIR CO₂ sensor, Dart HCHO sensor, audio alarm, USB data export, 3‑month continuous logging.
Charge the analyzer fully before use. Place it on a stable surface at the same height as the operator’s breathing zone. Press the power button to activate the colorful air‑quality indicator; green indicates safe levels, while yellow or red signals elevated dust concentrations.
Step 3: Calibrate Sensors for Accurate Readings
Both devices ship pre‑calibrated, but a brief verification ensures reliability. For the GoveeLife monitor, open the companion app, navigate to Settings, and run the “Auto‑Calibrate” routine. This process uses the built‑in algorithm to adjust for temperature drift.
For the Temtop Analyzer, connect the unit to a computer via the provided USB cable and launch the calibration utility. Follow the on‑screen prompts to perform a zero‑point calibration in a clean environment (ideally after a short ventilation period). Document the calibration date in your notebook for future reference.
Step 4: Conduct Real‑World Measurements During Woodworking
Start the woodworking task (e.g., sanding, cutting, or routing). Allow the dust to accumulate for a few minutes, then record readings from both devices every five minutes. The portable analyzer will display instantaneous PM2.5 and PM10 values, while the fixed monitor logs continuous data to the cloud.
Use the following procedure:
- Activate the dust‑generating tool.
- After two minutes, note the PM2.5 reading on the Temtop Analyzer. Press the Settings button for an instant refresh.
- Check the LED indicator on the GoveeLife monitor; a shift from green to yellow suggests a sustained increase.
- Repeat the measurement cycle for the duration of the task.
Document each timestamp, tool used, and ventilation status. This systematic approach creates a dataset that correlates specific activities with particle spikes.
Step 5: Export and Visualize Data
Once the session is complete, export the logged data for analysis. Connect the Temtop Analyzer to a computer and copy the CSV file from the internal storage. The file contains columns for CO₂, PM2.5, PM10, temperature, and humidity, enabling multi‑parameter correlation.
For the GoveeLife monitor, log in to the GoveeHome app, select the 13‑day graph, and use the “Export” button to download a two‑year history file. Import both CSV files into a spreadsheet program (e.g., Microsoft Excel or Google Sheets). Create a line chart with time on the x‑axis and PM2.5 concentration on the y‑axis. Overlay temperature and humidity to assess whether environmental conditions influence dust suspension.
Step 6: Interpret Results and Implement Controls
Analyze the chart for peak values exceeding 35 µg/m³ (the EPA’s “moderate” threshold for PM2.5). If peaks coincide with specific tools, consider the following actions:
- Install local exhaust ventilation (LEV) directly at the source.
- Use a high‑efficiency particulate air (HEPA) filter on the workshop’s central fan.
- Schedule regular breaks to allow air exchange.
- Employ dust collection bags on sanders and routers.
Re‑measure after implementing each control to verify effectiveness. A reduction of peak PM2.5 values by at least 20 % indicates a successful mitigation strategy.
Tips & Pro Tips
- Positioning matters: Avoid placing sensors too close to the dust source, as they may saturate and give falsely high readings.
- Maintain sensor cleanliness: Dust on the laser sensor lens can degrade accuracy. Gently wipe with a microfiber cloth weekly.
- Leverage automation: Link the GoveeLife monitor to compatible GoveeHome air purifiers; the system can automatically increase filtration when PM2.5 rises.
- Battery management: The Temtop Analyzer provides an audio alarm when battery levels drop below 20 %; recharge promptly to avoid data gaps.
- Use a reference monitor: If budget permits, the Temtop Air Quality Monitor offers a 7‑in‑1 sensor suite and 12‑hour trend histogram, useful for validating the readings of cheaper devices.
Troubleshooting
| Problem | Possible Cause | Solution |
|---|---|---|
| No data appears in the app | Wi‑Fi not connected or device offline | Restart the monitor, ensure it is within 10 m of the router, and re‑enter Wi‑Fi credentials. |
| Readings stay at zero | Sensor not warmed up | Allow at least 10 minutes after moving the device between temperature extremes before taking measurements. |
| Frequent alarm triggers | Threshold set too low | Adjust the alarm threshold in the device settings to a realistic level (e.g., 50 µg/m³ for workshop). |
Conclusion
By following this comprehensive, step‑by‑step process, one can accurately measure wood dust particle levels, export actionable data, and implement targeted ventilation improvements. Continuous monitoring with the GoveeLife Smart Air Quality Monitor and spot checks using the Temtop Air Quality Analyzer provide a robust solution that balances affordability with professional‑grade accuracy. Regular analysis ensures a healthier workshop environment and compliance with occupational safety guidelines.
Frequently Asked Questions
What type of air quality monitor is best for measuring wood dust in a small workshop?
A compact particulate matter (PM) sensor like the GoveeLife Smart Air Quality Monitor or Temtop models provides real‑time PM2.5/PM10 readings suitable for workshop environments.
How do I set up a baseline measurement for wood dust levels?
Place a fixed‑location sensor at breathing height away from direct airflow, power it on, let it run for at least 30 minutes, and record the initial PM readings as your baseline.
Can I export wood dust data for trend analysis?
Yes; most smart monitors allow Bluetooth or USB data export to a computer or app where you can generate charts of historical PM concentrations.
What ventilation changes are indicated by high wood dust readings?
If PM2.5 exceeds recommended limits (e.g., 35 µg/m³), increase local exhaust, add a filtered fan, or improve overall workshop airflow to reduce particle buildup.
Do I need calibration for these consumer‑grade monitors?
Periodic calibration using a known‑clean air source or the manufacturer’s reset function helps maintain accuracy, but daily checks against a baseline are usually sufficient for DIY use.